State of Environment Report
Cairns Regional Council produces a State of the Environment Report to:
- identify pressures on the natural environment
- report on responses Council is undertaking to help address these pressures
- monitor and evaluate the effectiveness of these responses.
With this knowledge, Council can strengthen its efforts to help conserve and restore our natural environment in collaboration with its partners.
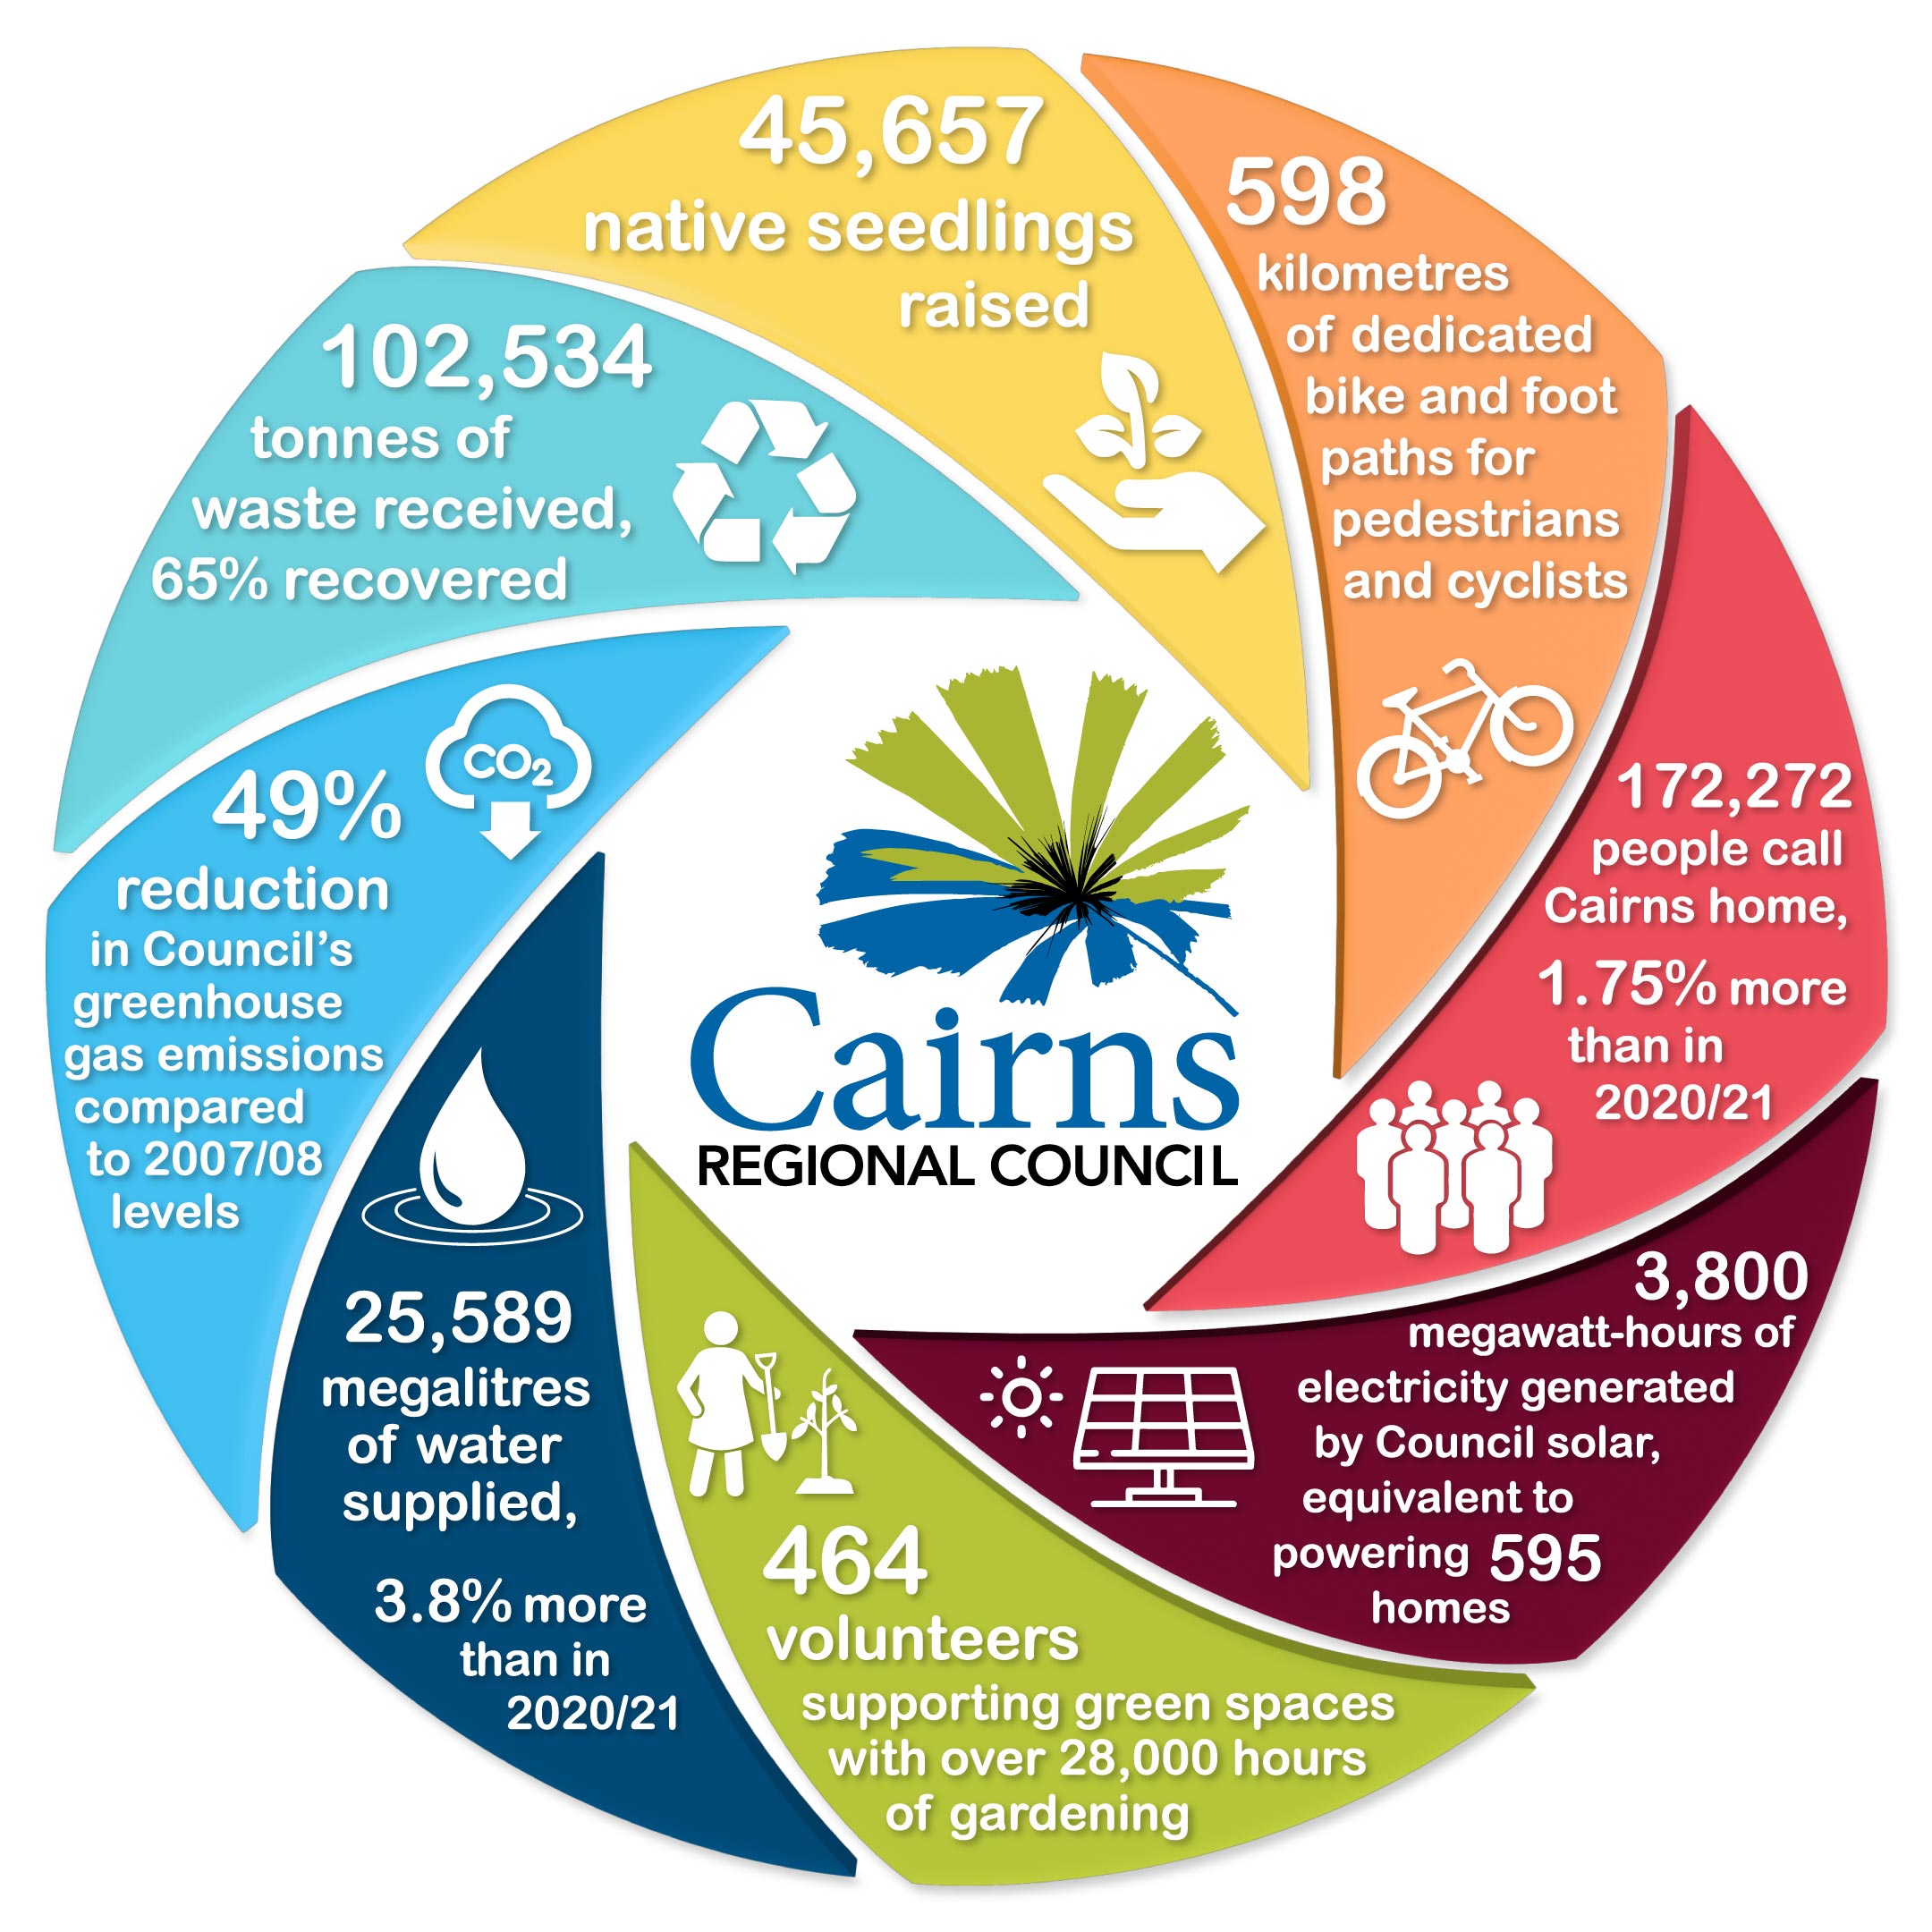
The latest State of Environment report was endorsed by Council on 12 July 2023. It summarises data from the 2021/22 financial year to assist with understanding the pressures on the local environment, its condition and key responses as they relate to Council's activities.
The next State of Environment report will be delivered in 2026/27, including updates to historical corporate greenhouse emissions.
The Queensland Government State of Environment, Australian Government State of Environment, State of Wet Tropics and Great Barrier Reef reports provide further information for interested readers.
Disclaimer: While every effort has been made to ensure that the information contained within this report is correct and up to date, Cairns Regional Council and all persons acting on its behalf in preparing this report accept no liability for the accuracy or inferences from the material contained in this publication, or for any action as a result of any person’s or group’s interpretations, deductions or conclusions relying on this material. Cairns Regional Council accepts no liability for any loss, damage or injury (including consequential loss, damage or injury) from the use of this information.
About the reporting
Each edition of the State of Environment report uses the most up to date data at the time, reflecting improved methodology and contemporary practices. Data discrepancy between reports can be due to a range of factors including but not limited to de-amalgamation with Douglas Shire, improved data or access to new information.
Last Updated: 10 November 2025
Latest News > All News

Traffic changes for Cairns Show
Residents are advised there will be changed traffic conditions associated with the Cairns Show....
10 July 2026
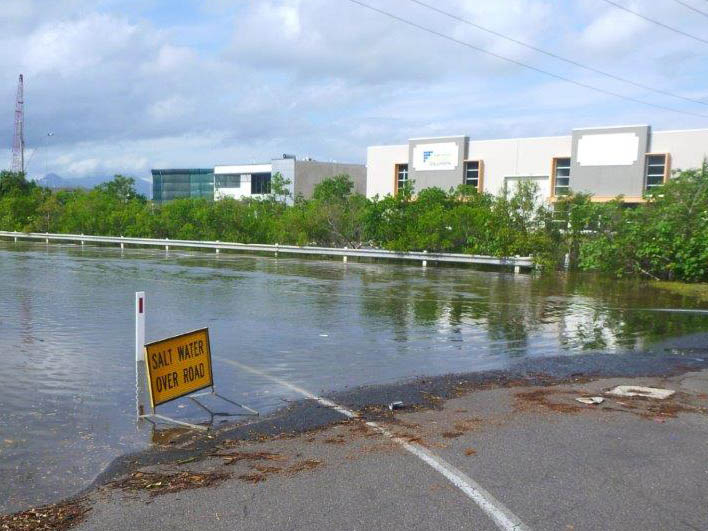
King tides to impact Cairns from Saturday
King tides are expected to affect Cairns this week, from Saturday 11 July to Friday 17 July....
8 July 2026
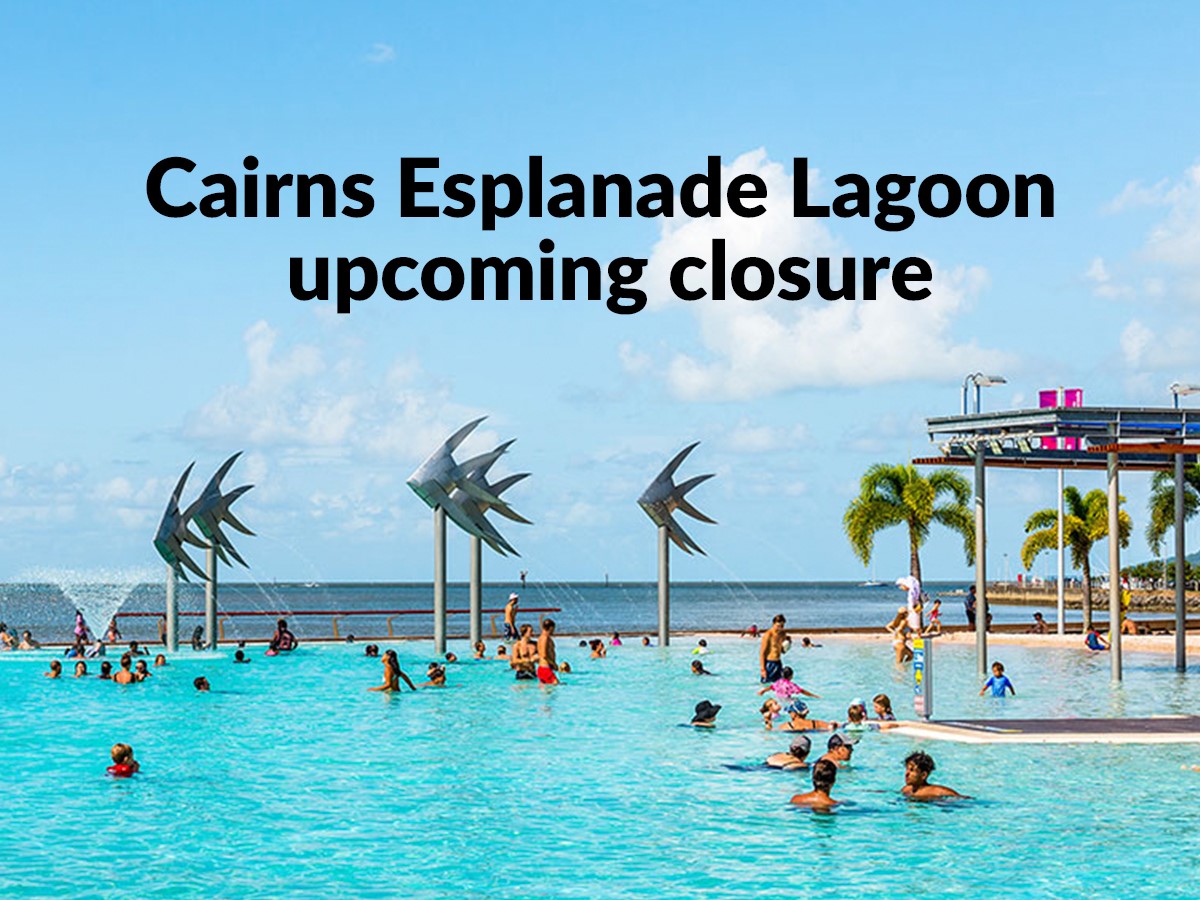
Esplanade Lagoon to close for essential maintenance
The Cairns Esplanade Lagoon will temporarily close from Monday 13 July to Sunday 16 August 2026 for its scheduled biennial...
8 July 2026